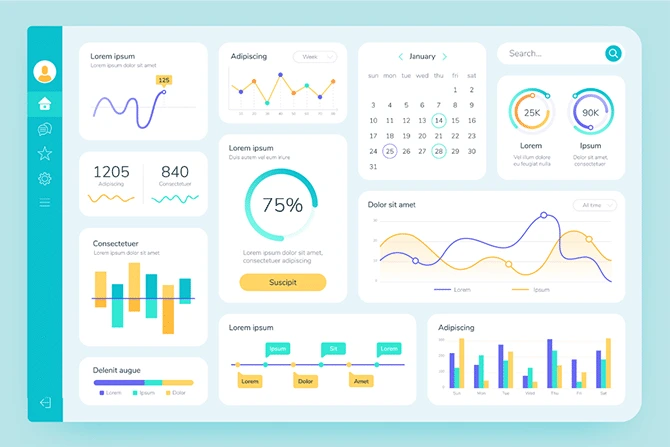
In today’s fast-paced business environment, the ability to make quick, data-driven decisions can be the difference between success and stagnation. For businesses, where competition is growing and markets are constantly evolving, having access to real-time insights is more crucial than ever. Enter interactive data dashboards—an essential tool that transforms raw data into actionable intelligence. In this blog, we’ll explore why every business needs an interactive dashboard and how it acts as a roadmap to success by leveraging business intelligence (BI) visualization and data analytics visualization tools.
The Evolution of Data Visualization and Its Role in Business Success
Data visualization has come a long way from traditional charts and reports. Today, businesses rely on interactive data dashboards that allow them to engage with their data in real time. This evolution is more than just a trend—it’s a necessity for staying competitive in a rapidly changing market.
What is Data Visualization and Why Is It Important?
At its core, data visualization is the practice of translating data into visual formats such as graphs, charts, or dashboards. The main purpose is to help businesses understand complex data quickly and identify patterns that might not be visible in raw numbers. For example, a retail business can use data discovery insights to track customer buying behaviors, helping them adjust their stock levels in real time.
By using data storytelling techniques, companies can transform complex data sets into clear, insightful stories that everyone in the organization can understand, from the C-suite to entry-level employees. This makes decision-making easier and more aligned with the company’s objectives.
The Shift to Interactive Data Dashboards: Moving Beyond Static Reports
While static reports offer valuable insights, they often fall short in a world that demands speed and flexibility. Custom data dashboards allow businesses to interact with data in real time, enabling them to slice, dice, and filter data on the fly. For example, companies in logistics can use visual data analysis to monitor shipment times, optimize routes, and reduce costs—all within an intuitive dashboard.
A prime example is Hayleys Advantis, which implemented QlikView to create interactive dashboards that replaced their static, time-consuming Excel reports. The result was faster, more detailed insights that allowed for better decision-making.
Key Benefits of Interactive Dashboards for Businesses
The shift to interactive dashboards is not just about making data look pretty; it’s about making data actionable. Here are some of the key benefits that businesses can gain from using BI reporting solutions.
Enhanced Decision-Making with Data Analytics Visualization
Data analytics visualization allows decision-makers to see patterns and trends in real time, enabling faster and more informed decisions. Imagine a manufacturing company that can track production levels in real time. With an interactive dashboard, they can immediately identify bottlenecks, monitor inventory, and adjust production plans to meet demand.
This capability becomes even more critical in industries like retail and finance, where a missed opportunity can result in lost revenue. By using interactive dashboards, businesses can spot trends early and react accordingly
Real-Time Insights and Data Discovery
With real-time data visualization, businesses no longer need to wait for end-of-month reports to get the insights they need. Dashboards update continuously, allowing companies to monitor key performance indicators (KPIs) and respond instantly. This is especially beneficial for companies that operate in fast-moving industries such as e-commerce or logistics, where real-time data is critical for maintaining a competitive edge.
Using custom data dashboards, companies can monitor everything from sales performance to customer engagement metrics, helping them pivot quickly when trends change.
The 5 Steps to Building an Effective Interactive Dashboard
Building an interactive data dashboard may seem daunting, but it’s easier than you think if you follow a structured approach. Here are five simple steps that businesses can follow to get started.
Step 1: Define Business Objectives and Key Metrics
The first step is to clearly define your business objectives. What do you want to achieve with your interactive dashboard? Whether it’s improving sales, optimizing operations, or enhancing customer satisfaction, your goals should guide the metrics you track. For example, a retail business might focus on tracking conversion rates and inventory levels, while a service-oriented company might prioritize customer satisfaction scores.
Step 2: Choose the Right Data Visualization Tools
There are numerous data visualization tools available, but not all are created equal. Tools like QlikView and Qlik Sense offer comprehensive solutions for both simple and complex BI visualization needs. While Qlik Sense is user-friendly and ideal for self-service analytics, QlikView offers advanced features for businesses that require highly customized solutions.
Curious about how interactive dashboards can enhance your business strategy? Check out our comparison of QlikView vs Qlik Sense to find the best data visualization tool for your needs!
Step 3: Design with User Experience in Mind
A dashboard is only as useful as its design. Make sure that your interactive dashboard is intuitive, easy to navigate, and visually appealing. Use data storytelling techniques to present your data in a way that makes sense to your audience, helping them make informed decisions quickly.
Step 4: Implement Real-Time Data Integration
One of the most powerful features of an interactive dashboard is the ability to connect with multiple data sources and update in real time. For businesses, this means integrating data from various departments like sales, marketing, and operations into one cohesive dashboard. This ensures that decision-makers have the most up-to-date information available at all times.
Step 5: Regularly Update and Improve Dashboards
Finally, it’s essential to regularly review and update your dashboard to ensure it continues to meet your business needs. As your company grows and evolves, so too should your custom data dashboards. Keep adding new data sources, update KPIs, and refine the dashboard’s layout to match the changing business landscape.
Building Your Interactive Dashboard Strategy: What to Consider
When building an effective interactive dashboard strategy, it’s crucial to focus on the right partner to ensure that the implementation is smooth and delivers measurable results. A reliable partner can help businesses integrate data sources, design user-friendly interfaces, and optimize performance.
From logistics companies tracking shipments to manufacturers monitoring production, the key to successful dashboard implementation lies in selecting a solution that not only meets current needs but is also scalable for future growth. Selecting a tool that offers flexibility and expertise ensures your business has the right foundation to turn data into actionable insights, no matter the complexity of your operations.
Businesses that partner with experienced BI solutions providers often see faster results, improved data accuracy, and reduced risk. Whether it’s setting up Qlik Sense or QlikView, having access to tailored support can transform a dashboard from just another tool into a driver of long-term success.
Conclusion: Interactive Dashboards as the Gateway to Business Success
In conclusion, interactive dashboards have become indispensable for businesses aiming to leverage real-time data visualization and make informed decisions quickly. By implementing a customized dashboard solution, companies can transform raw data into actionable insights that fuel growth, enhance operational efficiency, and create a strategic roadmap to success.
Whether you’re looking to improve your sales, optimize operational workflows, or make data-driven strategic decisions, interactive dashboards provide the tools to unlock valuable insights from your data. It’s no longer a question of if you need a dashboard, but when you will take the step to adopt one.
With the right strategy and support, your business can seamlessly integrate interactive dashboards that enhance decision-making and future-proof your operations


